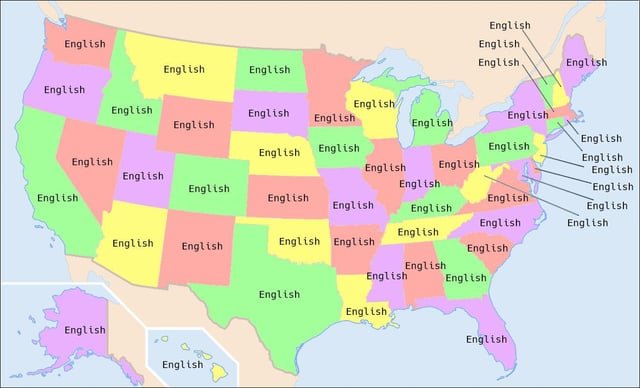
Spanish remains the dominant non-English language across the United States, but a fresh look at 2024 American Community Survey data reveals just how differently each state’s “second language” landscape takes shape once you go beyond the border.
While Spanish is the most spoken non-English language in 47 of 50 states, a new analysis of 2024 American Community Survey data from The Mendoza Law Firm shows that the second most common language nationwide varies dramatically by region, painting a detailed picture of America’s diaspora communities.
Eleven languages are spoken by more than a million people in the United States, with the ten largest non-English languages accounting for roughly 58.5 million speakers combined.
Spanish leads overwhelmingly with 44.4 million speakers, 75.9% of that total, followed by Chinese, including Mandarin and Cantonese, at 3.7 million speakers.
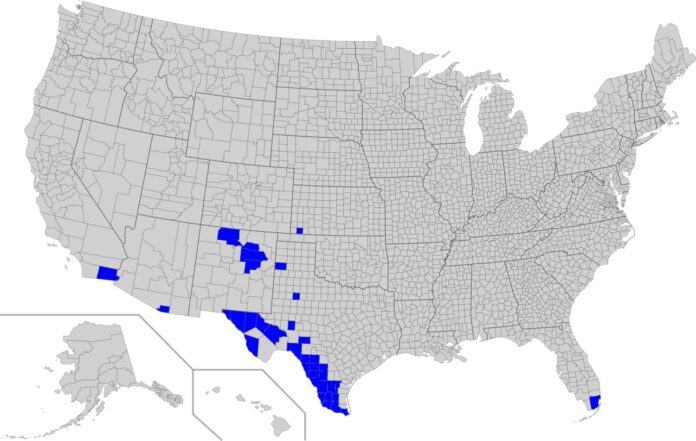
Tagalog, including Filipino, ranks third with 1.8 million speakers, ahead of Vietnamese (1.6 million), Arabic (1.5 million), French including Cajun (1.2 million), Korean (1.1 million), Portuguese (1.1 million), Hindi (1.1 million) and Haitian Creole (1 million), the last reflecting rapidly growing Haitian communities in South Florida, New York and Massachusetts.
Chinese ranks as the second most common non-English language in 13 states, including California, with 1.3 million speakers, New York (646,302), Washington (160,131), New Jersey (138,338) and Pennsylvania (96,813).
Other states show markedly different second place languages shaped by local immigration patterns.
Vietnamese ranks second in Texas, with 254,659 speakers concentrated largely in Houston, while Portuguese ranks second in Massachusetts with 247,638 speakers.
French, including Cajun, ranks second in Louisiana with 57,844 speakers, as well as in Nebraska, New Hampshire and South Carolina, and Arabic ranks second in Michigan (190,833 speakers), Tennessee (30,232) and Virginia (65,738).
Navajo ranks second in Arizona with 70,691 speakers, Hmong ranks second in Wisconsin with 36,777, and West African languages including Yoruba, Twi and Igbo rank second in Maryland with 75,279 speakers.
In Minnesota and the District of Columbia, large East African communities mean Amharic, Somali and related languages rank second.
The rate of limited English proficiency also varies considerably by language group. Vietnamese speakers recorded the highest LEP rate among major language groups at 57.5%, followed by Chinese (50.7%) and Korean (49%) speakers.
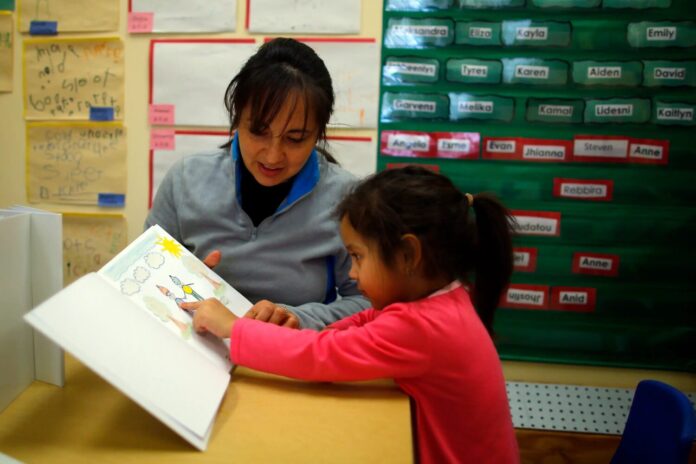
Spanish speakers carry a comparatively lower LEP rate of 41.1%, but their far larger population means they still account for more than 18.2 million LEP residents, by a wide margin the largest LEP population of any language group nationally.
Haitian Creole speakers recorded a 43.7% LEP rate, Russian speakers 42.2%, Portuguese 36%, and Arabic 34.6%, while Hindi (16.5%) and French (22.1%) speakers recorded the lowest LEP rates among high-use languages.
Across the ten largest language groups combined, 23.9 million people are classified as having limited English proficiency.
State-level detail reinforces just how distinct each region’s linguistic profile is. Florida is home to the nation’s largest Haitian Creole-speaking population at 512,329, alongside 210,218 Portuguese and 123,268 French speakers, while New York’s 2.7 million LEP residents include 646,302 Chinese speakers, 244,264 Yiddish and West Germanic speakers, 209,622 Russian speakers and 192,476 Bengali speakers.
“No two states look the same when it comes to who lives there and what language they speak at home,” said a spokesperson for The Mendoza Law Firm.
“That diversity is part of what makes this country what it is, and it’s exactly why the families we work with deserve legal guidance that meets them where they are.”
Beyond the state-by-state breakdown of second-place languages, the broader data paints an equally striking national picture.
Roughly 74.1 million U.S. residents aged five and older now speak a language other than English at home, a figure that works out to 23% of the population and marks a substantial jump from the approximately 60 million recorded between 2009 and 2013.
Census figures put the total number of languages spoken or signed across the country at more than 430, among them 177 indigenous languages, underscoring how the United States remains one of the most linguistically varied nations on earth.
That diversity, however, is anything but evenly distributed. California tops every state for non-English language use, with 45.3% of residents aged five and older, 16.9 million of its 37.3 million population, speaking a language other than English at home.
Spanish speakers alone make up 28.8% of the state’s population, or roughly 10.8 million people.
Texas ranks second nationally at 35.7%, equivalent to just over 10.5 million of its 29.3 million residents, with New Jersey (34.3%), Florida (32.0%) and New York (31.6%) rounding out the top five.
Together, these ten leading states account for 49.1 million non-English speakers, nearly two-thirds of the national total.
At the opposite end of the spectrum, West Virginia records the country’s lowest share of non-English speakers at just 2.8%, fewer than 47,600 people, followed by Montana (4.5%), Mississippi (4.6%), Vermont (5.8%) and Maine (6.3%).

Correspondingly, West Virginia also posts the highest rate of English-only households at 97.2%, with Montana, Mississippi, Vermont, Maine, Wyoming and Alabama all reporting English-only rates above 93%.
California sits at the other extreme, with just 54.7% of its residents speaking only English at home, meaning close to half the state’s population lives in a multilingual household.
These regional gaps translate directly into how many residents face limited English proficiency (LEP), a status defined as speaking English less than “very well.”
California alone is home to an estimated 6.7 million LEP residents, 17.9% of its population, while Texas (3.9 million), Florida (3 million), New York (2.7 million) and New Jersey (1.2 million) round out the states with the largest LEP populations.
Nationally, some 28.9 million people qualify for language assistance in courts, hospitals, schools and government offices under this definition.
The demand this creates for bilingual professionals has grown sharply.
Job postings seeking bilingual candidates more than doubled between 2010 and 2015, climbing from around 240,000 to over 630,000, and that momentum hasn’t slowed: postings rose another 24% in 2023 alone, with bilingual healthcare roles up 35%.
Roughly 40% of Fortune 500 companies now actively recruit bilingual staff, and nearly a quarter of employers report having lost or passed on business opportunities due to a shortage of foreign-language skills on their teams.
Bilingual employees are typically compensated accordingly, earning between 5% and 20% more than their monolingual peers, with bilingual nurses commanding roughly $10,000 more per year on average.
For law firms and public agencies alike, the takeaway is the same: language access isn’t a peripheral concern but a structural feature of how millions of Americans interact with the legal system, healthcare and their own communities.