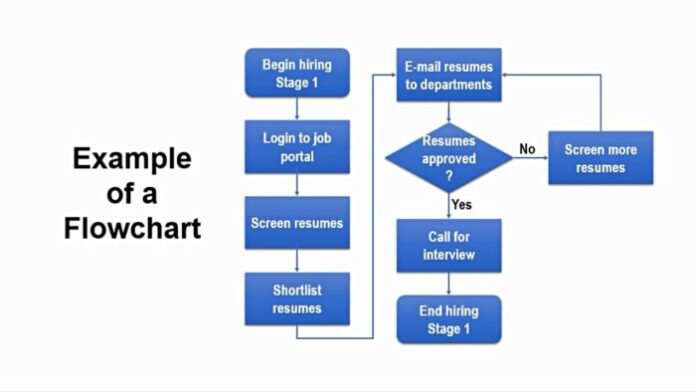
The flowchart is a graphical representation of a computer algorithm. It provides a description based on modeling the flow of information around a network of operational elements where each element uses or changes the information that goes to that element. This sets the workflow step by step. Diagrams can be simple and contain only a few steps, but they can also be extremely complex.
Although diagrams are often associated with programming, they are also used in other industries. Moreover, the flowchart was created long before the computer revolution. It is assumed that the basic form of the present-day diagram originated in several places, at different times, developing completely independently.
Over time, a system specific to computer algorithms has evolved, making it easier to navigate while working. There are certain rules when it comes to graphing a diagram. Each step during the process is marked with a specific field. Symbols representing certain steps in the diagram are standardized. These can be different types of actions: decision making, data printing, etc.
Basic flowchart symbols

-Operation – Enter commands to assign specific values. Data processing is done in this block.
-Branching (arithmetic decision) – Allows three different actions depending on the result, i.e. has one inlet branch and three outlet.
-Branching (logical decision) – The veracity of a query is examined, on the basis of which one is selected twice. There is one inlet branch and two outlet.
-Data Input – Enter data to be processed further.
-Data Output – Represents data that shows the end result displayed somewhere.
-Flow Line – Connects the symbols in the diagram and uses the arrows to explain in which direction the process is moving. As a rule, the stream moves from top to bottom or left to right.
-Border point – Start, stop, stop, etc.
-Hub – The place where flow lines connect. In this case there may be more than one input line, but it is possible to have only one output line
Creating a flowchart

Flowcharting is an integral part of the process in many branches. In order to create the desired program, it is necessary to clearly define the operations that can be performed. In doing so, it is important to anticipate all possible “scenarios”, ie. situations that can occur during the process. For this reason, a diagram can sometimes be very complex, with a lot of branching.
In this way, the developer faces all the challenges on time, so he can plan the way to approach coding. Also, every project, and therefore the flowchart, must have a clear goal, ie. start and finish. That means we need to know exactly what we want to achieve. In that case, with a clearly defined goal, we start to create diagrams.
When you start designing on a step-by-step basis, you will face the first challenges very quickly. One of the main prerequisites for successful creation of flowcharts is the knowledge of matter and the knowledge to create solutions. This is often not a technical problem because the program can handle anything.
For example, you might be writing a program for a client who wants to develop software for their business. In this case, you will need to understand the subject matter of the program. Otherwise you won’t even be able to start programming, no matter how skilled. That is why it is important to refer to the matter well, but also to define the initial data as well as the output data precisely.
In this case, it will be much clearer what you need to do between the two end points of the diagram. If the flowchart is well defined, the programming itself will be much easier. The next step is to choose a methodology that will solve the task and show the final result. The very creation of the diagram, and later the program itself, is influenced by many elements that are closely related to the topic, rules, and mode (which has its limitations).
How to make a flowchart in PowerPoint?

There are certainly simpler ways than making a flowchart in PowerPoint. If you want to get to your flowchart easier, click here. If you still want to do it yourself in PowerPoint we will walk you through the steps.
MS PowerPoint is the world’s most popular presentation software. But making a flowchart is certainly not his primary purpose. You can make using SmartArt or using the available shapes.
Using SmartArt

SmartArt offers you already made shapes, which do not contain too many different options. It’s certainly an easier and quicker way because you don’t have to do everything, but you won’t be able to do whatever you want. If you need simplicity, then this is the right choice. There are ways to add a few more things, but again it won’t add much to the visual.
Follow these steps. Navigate to the SmartArt option and select the flowchart option. Then choose a shape. To enter text, just click on the selected shape. As you move the new shapes you insert, they will automatically be connected by arrows. You have SmartArtDesign options and you can customize it further. The choice will be only among the options and colors already offered.
Using shape library

This creation method will certainly take you more time, but you will be able to be more detailed and flexible. Each shape and arrow will be positioned by you where you want it. It certainly offers far more options than SmartArt.
Select the insert option and then shapes and options to choose from will appear. Here you will find everything you need to create a flowchart. You will also see a preview of what this will look like. There you will drag one by one shape.
Then follows the main difference between this method and the previous one. With the arrows, you will determine what they connect, which is very important because that is the essence of this diagram. You will find them in the same place after clicking on the insert. Once you have selected this, you will use the mouse to connect.
As for text writing, it’s the same. Click where you want and write here. If you want to write in the arrows, then you have to click insert again, then the text box and then add text.
Conclusion:

Eventually, PowerPoint will customize the whole layout to its interface. If you are satisfied with the look, this would be it. If not, then you have a variety of options to choose like colors and other elements.


